
Williams Percent Range indicator: what is it?
-
 Skilling Writers Team
-

-

- Education
- Trading
- Technical Analysis


Dive into the world of the Williams Percent Range (%R) Indicator, a powerful oscillator created by Larry Williams. Similar to the Stochastics Indicator and Relative Strength Index (RSI) but with its unique characteristics, the %R Indicator is essential for traders looking to identify overbought and oversold conditions and pivotal moments in market trends. This guide will explore how to effectively utilize the %R Indicator in your trading strategy, enhancing your market analysis in 2024.
What is the Williams Percent Range indicator?
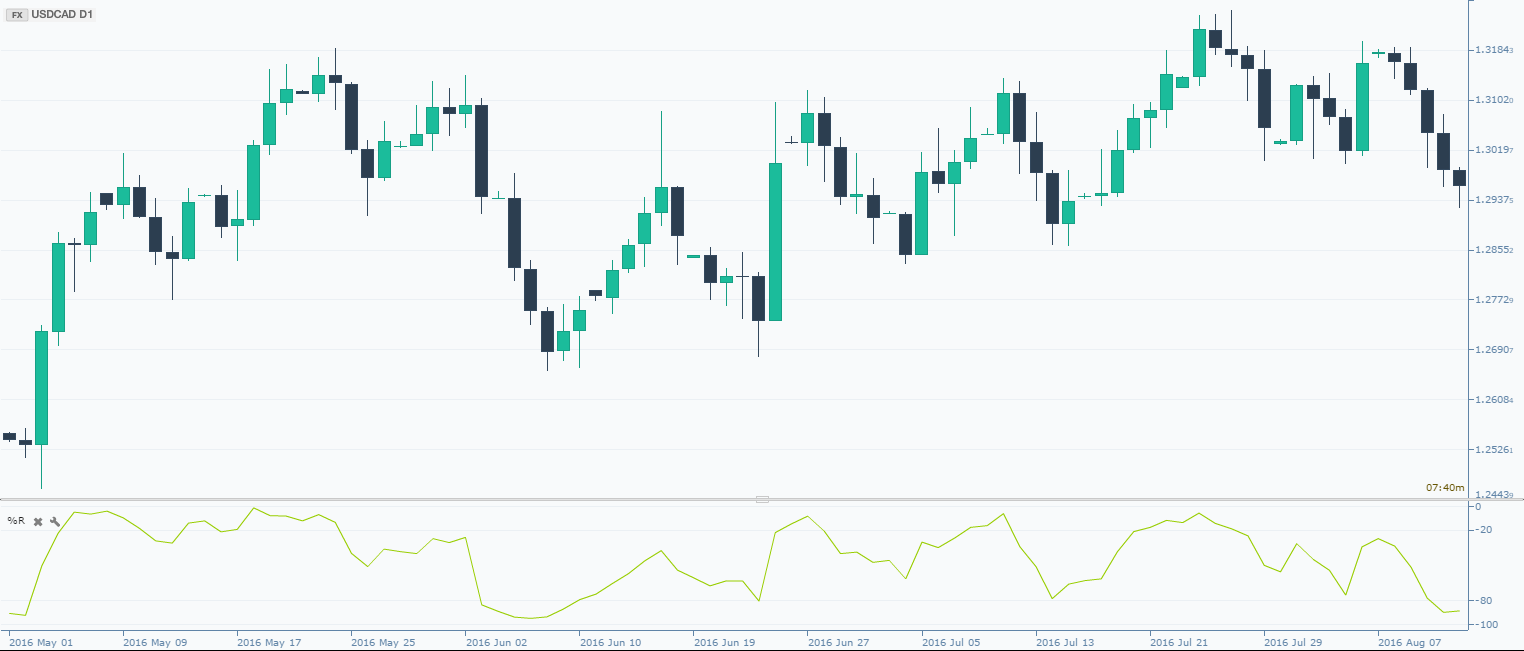
The Williams Percent Range, also known as "%R," is a tool that traders use to see if stocks are being bought or sold a lot. It was made by Larry Williams and works a bit like another tool called the Stochastic indicator, but it's simpler and the numbers are flipped around. This tool helps traders figure out when the market might change direction. The %R moves between zero and -100. On its chart, there are special lines at -20 and -80. These lines are like warning signs. If the %R is between -80 and -100, it means a lot of selling is happening. If it's between -20 and 0, it means a lot of buying is happening.
Here's how to calculate it: Take the highest price, subtract the current closing price, then divide that by the difference between the highest price and the lowest price, and finally multiply by -100.
Highest High - Close Price / Highest High - Lowest Low x -100.
Here’s a step-by-step example:
- Imagine you're looking at a stock's chart and you're using the Williams %R to help make your trading decisions. The %R value is currently at -30. This number falls between -20 and 0, which is the area that suggests a lot of buying is happening, or in technical terms, the stock is 'overbought.' This might mean that the stock's price could soon start to go down because it's been bought so much already.
- Now, let's say a few days later, you notice the %R has dropped to -85. This time, it's in the -80 to -100 range, indicating the stock is 'oversold.' A lot of selling has been happening, and this could be a sign that the stock's price might start to rise soon, as selling pressure eases.
- In both cases, you wouldn't make a decision based just on the %R. Instead, you'd look at other signs and tools to confirm what the %R is suggesting. Maybe you'd check if there's been a big news release affecting the stock, or you'd look at the overall market trend. By combining the %R with other information, you can make a more informed decision about when to buy or sell the stock."
- The %R looks at how the closing price of a stock compares to its prices over a certain time, usually 14 days. It can also show longer trends. For example, if you look at 125 days, it can show about six months of trends. If the %R is above -50, it usually means prices are going up. If it's below -50, prices might be going down.
In addition traders can use the %R to identify longer trends in the market - for instance a 125-day %R would cover around six months. Prices are above their 6-month average when %R is above -50, which is consistent with an uptrend. Readings below -50 are consistent with a downtrend.
Like all technical indicators, it is important to use this indicator together with other technical tools. Volume chart patterns and breakouts can be used to confirm or refute signals produced by Williams %R.
Trade Demo: Real trading conditions with zero risk
Trade risk-free on Skilling’s award winning platforms with a 10k* demo account.

FAQs
- What is the Williams Percent Range Indicator?
- The Williams Percent Range, or %R, is an oscillator that helps traders identify overbought and oversold conditions in the market.
- How is the Williams %R Indicator calculated?
- It is calculated using the formula: (Highest High - Closing Price) / (Highest High - Lowest Low) x -100, over a chosen period, typically 14 days.
- How can traders use the Williams %R Indicator?
- Traders can use it to spot potential reversals by looking for readings above -20 (overbought) or below -80 (oversold).
- What makes the Williams %R Indicator unique?
- Unlike some oscillators, it doesn't include a smoothing component and uses an inverted scale, offering a different perspective on market momentum.
- How does the Williams %R Indicator differ from the Stochastic Oscillator?
- While both the Williams %R and the Stochastic Oscillator measure overbought and oversold levels, the Williams %R lacks the smoothing mechanism found in the Stochastic Oscillator and uses an inverted scale. This results in the Williams %R reacting more quickly to price changes.
- Can the Williams %R Indicator be used for all types of assets?
- Yes, the Williams %R Indicator is versatile and can be applied to various asset types, including stocks, forex, commodities, and indices. It is effective in different market conditions, making it a useful tool for diverse trading strategies.
- What time frames work best with the Williams %R Indicator?
- The Williams %R Indicator can be used with various time frames, from short-term (like daily charts) to long-term (like weekly or monthly charts). The choice of time frame depends on the trader's strategy and the type of asset being traded.
- How should traders interpret the -50 level on the Williams %R Indicator?
- The -50 level is often considered a midpoint reference. Readings above -50 can indicate a potential bullish trend, while readings below -50 might suggest a bearish trend. However, this should be confirmed with other indicators and analysis.
- Is the Williams %R Indicator effective in a sideways market?
- The Williams %R Indicator can still provide valuable insights in a sideways or ranging market by identifying potential overbought and oversold conditions within the range. However, its effectiveness might be limited compared to trending markets, and it should be used alongside other analysis tools.
- How can traders avoid false signals from the Williams %R Indicator?
- To minimize false signals, traders should use the Williams %R Indicator in conjunction with other technical analysis tools, such as trend lines, moving averages, or volume indicators. Confirming signals with additional analysis helps improve trading accuracy.
- Can the Williams %R Indicator predict market reversals?
- While the Williams %R Indicator is adept at identifying overbought and oversold conditions, it should not be solely relied upon to predict market reversals. Traders should look for confirmation from other indicators and market analysis to validate potential reversals.
- Is the Williams %R Indicator suitable for beginners?
- While it can be more complex than some basic indicators, with proper understanding and practice, it is a valuable tool for traders at all levels.
Summary
The Williams Percent Range, commonly known as the %R Indicator, is a valuable tool in the world of trading. The %R Indicator helps traders by showing when stocks might be bought or sold too much, which we call 'overbought' or 'oversold' conditions. These insights are crucial for predicting potential shifts in market trends.
It's important to remember that the Williams %R, like any technical indicator, should not be used in isolation. For the most effective trading strategy, it should be combined with other tools and market analysis methods. This approach helps confirm the signals the %R provides and leads to more informed and successful trading decisions.
By understanding and applying the Williams Percent Range Indicator effectively, traders can gain a deeper insight into market dynamics and enhance their ability to make profitable trades.
Are you ready to experience an enhanced trading journey with the Williams Percent Range Indicator strategy?
Dive deeper into the world of technical analysis and unlock the full potential of this versatile tool. Whether you're a beginner or an experienced trader, our education center can provide you with the knowledge and skills to make more informed trading decisions.
Don't miss this opportunity to refine your trading techniques and strategies Join Skilling today and get help for more successful trades!
Experience Skilling's award-winning platform
Try out any of Skilling’s trading platforms on the device of your choice across web, android or iOS.

Not investment advice. Past performance does not guarantee or predict future performance.


