
Indicatore Williams Percent Range: cos'è?
-
 Team scrittori Skilling
-

-

- Educazione
- Negoziazione
- Technical Analysis


Immergiti nel mondo dell'indicatore Williams Percent Range (%R), un potente oscillatore creato da Larry Williams. Simile all'Indicatore stocastico e all'Indice di forza relativa (RSI) ma con le sue caratteristiche uniche, l'indicatore %R è essenziale per i trader che desiderano identificare condizioni di ipercomprato e ipervenduto e momenti cruciali nelle tendenze del mercato. Questa guida esplorerà come utilizzare in modo efficace l'indicatore %R nella tua strategia di trading, migliorando la tua analisi di mercato nel 2024.
Cos'è l'indicatore Williams Percent Range?
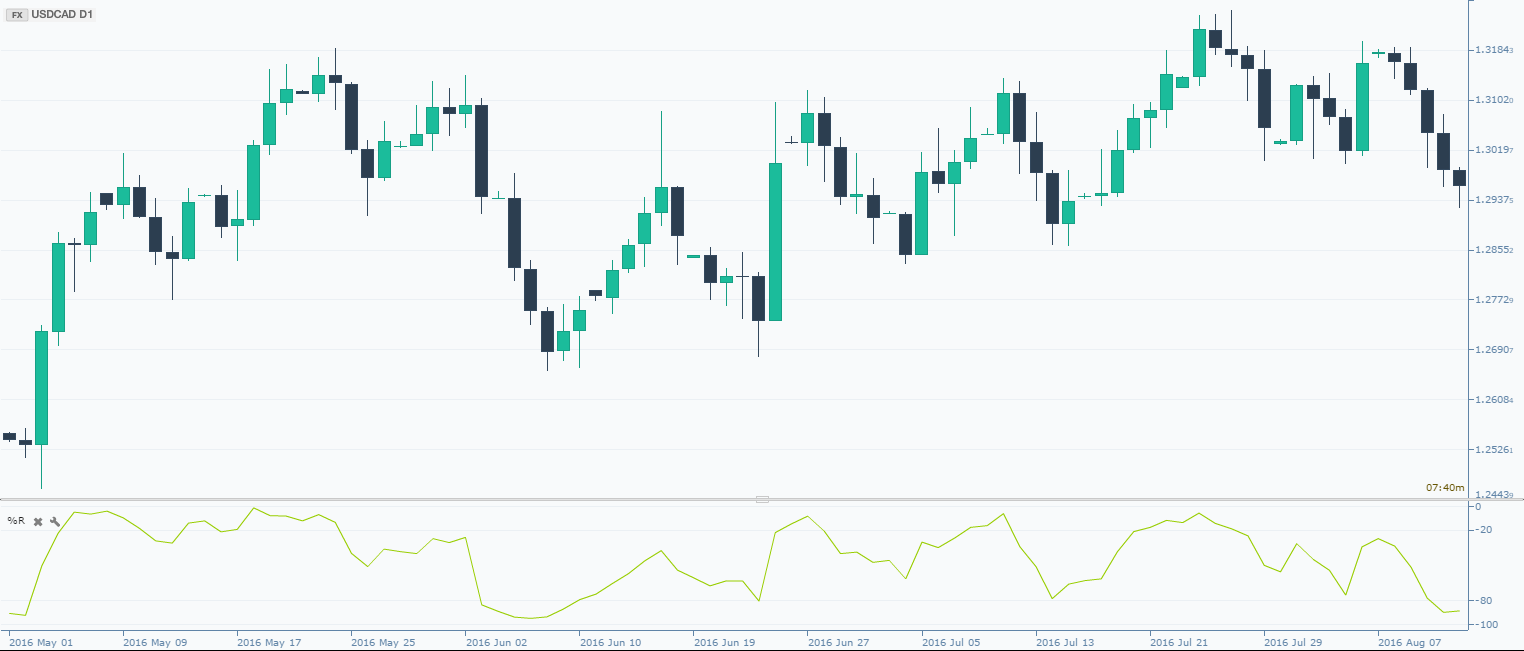
Il Williams Percent Range, noto anche come "%R", è uno strumento utilizzato dai trader per vedere se le azioni vengono acquistate o vendute molto. È stato realizzato da Larry Williams e funziona un po' come un altro strumento chiamato indicatore stocastico, ma è più semplice e i numeri vengono invertiti. Questo strumento aiuta i trader a capire quando il mercato potrebbe cambiare direzione. Il %R si sposta tra zero e -100. Sul suo grafico ci sono linee speciali a -20 e -80. Queste linee sono come segnali di pericolo. Se il %R è compreso tra -80 e -100, significa che sono in corso molte vendite. Se è compreso tra -20 e 0, significa che si stanno effettuando molti acquisti.
Ecco come calcolarlo: prendi il prezzo più alto, sottrai il prezzo di chiusura corrente, quindi dividilo per la differenza tra il prezzo più alto e quello più basso e infine moltiplicalo per -100.
Massimo più alto - Prezzo di chiusura / Massimo più alto - Minimo più basso x -100.
Ecco un esempio passo passo:
- Immagina di guardare il grafico di un titolo e di utilizzare il Williams %R per prendere le tue decisioni di trading. Il valore %R è attualmente a -30. Questo numero è compreso tra -20 e 0, che è l'area che suggerisce che si stanno verificando molti acquisti o, in termini tecnici, il titolo è "ipercomprato". Ciò potrebbe significare che il prezzo delle azioni potrebbe presto iniziare a scendere perché è già stato acquistato così tanto.
- Ora, diciamo qualche giorno dopo, noti che %R è sceso a -85. Questa volta è compreso tra -80 e -100, a indicare che il titolo è "ipervenduto". Si sono verificate molte vendite e questo potrebbe essere un segnale che il prezzo del titolo potrebbe iniziare a salire presto, man mano che la pressione di vendita si allenterà.
- In entrambi i casi, non prenderesti una decisione basandoti solo sul %R. Invece, guarderesti altri segni e strumenti per confermare ciò che suggerisce% R. Forse controlleresti se c'è stato un grande comunicato stampa che ha interessato il titolo o guarderesti l'andamento generale del mercato. Combinando la %R con altre informazioni, puoi prendere una decisione più informata su quando acquistare o vendere le azioni."
- Il %R esamina il confronto tra il prezzo di chiusura di un titolo e i suoi prezzi in un determinato periodo, solitamente 14 giorni. Può anche mostrare tendenze più lunghe. Ad esempio, se consideri 125 giorni, puoi mostrare circa sei mesi di tendenze. Se il %R è superiore a -50, di solito significa che i prezzi stanno aumentando. Se è inferiore a -50, i prezzi potrebbero scendere.
In addition traders can use the %R to identify longer trends in the market - for instance a 125-day %R would cover around six months. Prices are above their 6-month average when %R is above -50, which is consistent with an uptrend. Readings below -50 are consistent with a downtrend.
Like all technical indicators, it is important to use this indicator together with other technical tools. Volume chart patterns and breakouts can be used to confirm or refute signals produced by Williams %R.
Demo commerciale: Condizioni di trading reali a rischio zero
Fai trading senza rischi sulle pluripremiate piattaforme di Skilling con un conto demo da 10.000*.

Domande frequenti
- Che cos'è l'indicatore dell'intervallo percentuale Williams?
- Il Williams Percent Range, o %R, è un oscillatore che aiuta i trader a identificare le condizioni di ipercomprato e ipervenduto nel mercato.
- Come viene calcolato l'indicatore Williams %R?
- Viene calcolato utilizzando la formula: (Massimo più alto - Prezzo di chiusura) / (Massimo più alto - Minimo più basso) x -100, nell'arco di un periodo prescelto, in genere 14 giorni.
- Come possono i trader utilizzare l'indicatore Williams %R?
- I trader possono utilizzarlo per individuare potenziali inversioni cercando valori superiori a -20 (ipercomprato) o inferiori a -80 (ipervenduto).
- Cosa rende unico l'indicatore Williams %R?
- A differenza di alcuni oscillatori, non include una componente di livellamento e utilizza una scala invertita, offrendo una prospettiva diversa sullo slancio del mercato.
- In cosa differisce l'indicatore Williams %R dall'oscillatore stocastico?
- Mentre sia il Williams %R che l'oscillatore stocastico misurano i livelli di ipercomprato e ipervenduto, il Williams %R non dispone del meccanismo di livellamento presente nell'oscillatore stocastico e utilizza una scala invertita. Ciò fa sì che il Williams %R reagisca più rapidamente alle variazioni di prezzo.
- L'indicatore Williams %R può essere utilizzato per tutti i tipi di risorse?
- Sì, l'indicatore Williams %R è versatile e può essere applicato a vari tipi di asset, tra cui azioni, forex, materie prime e indici. È efficace in diverse condizioni di mercato, rendendolo uno strumento utile per diverse strategie di trading .
- Quali intervalli di tempo funzionano meglio con l'indicatore Williams %R?
- L'indicatore Williams %R può essere utilizzato con vari intervalli di tempo, dal breve termine (come i grafici giornalieri) al lungo termine (come i grafici settimanali o mensili). La scelta dell'intervallo di tempo dipende dalla strategia del trader e il tipo di asset scambiato.
- Come dovrebbero interpretare i trader il livello -50 sull'indicatore Williams %R?
- Il livello -50 è spesso considerato un punto di riferimento medio. Letture superiori a -50 possono indicare un potenziale trend rialzista, mentre letture inferiori a -50 potrebbero suggerire una tendenza ribassista. Tuttavia, ciò dovrebbe essere confermato con altri indicatori e analisi.
- L'indicatore Williams %R è efficace in un mercato laterale?
- L'indicatore Williams %R può comunque fornire informazioni preziose in un mercato laterale o in espansione identificando potenziali condizioni di ipercomprato e ipervenduto all'interno dell'intervallo. Tuttavia, la sua efficacia potrebbe essere limitata rispetto ai mercati di tendenza e dovrebbe essere utilizzato insieme altri strumenti di analisi.
- Come possono i trader evitare falsi segnali dall'indicatore Williams %R?
- Per ridurre al minimo i falsi segnali, i trader dovrebbero utilizzare l'indicatore Williams %R insieme ad altri strumenti di analisi tecnica, come linee di tendenza, medie mobili o indicatori di volume. Confermare i segnali con analisi aggiuntive aiuta a migliorare la precisione del trading.
- L'indicatore Williams %R può prevedere le inversioni di mercato?
- Sebbene l'indicatore Williams %R sia efficace nell'identificare condizioni di ipercomprato e ipervenduto, non dovrebbe essere utilizzato esclusivamente per prevedere inversioni di mercato. I trader dovrebbero cercare conferma da altri indicatori e analisi di mercato per convalidare potenziali inversioni.
- L'indicatore Williams %R è adatto ai principianti?
- Sebbene possa essere più complesso di alcuni indicatori di base, con una corretta comprensione e pratica, è uno strumento prezioso per i trader a tutti i livelli.
Riepilogo
L'intervallo percentuale Williams, comunemente noto come indicatore %R, è uno strumento prezioso nel mondo del trading. L'indicatore %R aiuta i trader mostrando quando le azioni potrebbero essere acquistate o vendute in misura eccessiva, condizioni che chiamiamo condizioni di "ipercomprato" o "ipervenduto". Queste informazioni sono cruciali per prevedere potenziali cambiamenti nelle tendenze del mercato.
È importante ricordare che il Williams %R, come qualsiasi indicatore tecnico, non dovrebbe essere utilizzato isolatamente. Per una strategia di trading più efficace, dovrebbe essere combinata con altri strumenti e metodi di analisi di mercato. Questo approccio aiuta a confermare i segnali forniti da %R e porta a decisioni di trading più informate e di successo.
Comprendendo e applicando in modo efficace l'indicatore Williams Percent Range, i trader possono acquisire una visione più approfondita delle dinamiche di mercato e migliorare la loro capacità di effettuare operazioni redditizie.
Sei pronto a vivere un viaggio di trading potenziato con la strategia Williams Percent Range Indicator?
Immergiti più a fondo nel mondo dell'analisi tecnica e sblocca tutto il potenziale di questo strumento versatile. Che tu sia un principiante o un trader esperto, il nostro centro di formazione può fornirti le conoscenze e le competenze per prendere decisioni di trading più informate.
Non perdere questa opportunità per affinare le tue tecniche e strategie di trading Unisciti a Skilling oggi e ottieni aiuto per operazioni di maggior successo!
Prova la pluripremiata piattaforma di Skilling
Prova una qualsiasi delle piattaforme di trading di Skilling sul dispositivo di tua scelta su Web, Android o iOS.

Non e' consiglio di investimento. La performance passata non garantisce né determina la performance futura.


