


[[ data.name ]]
[[ data.ticker ]]
[[ data.price ]] [[ data.change ]] ([[ data.changePercent ]]%)
Low: [[ data.low ]]
High: [[ data.high ]]
Copper: The Pulse of Global Industry and Economic Health
Copper, often nicknamed "Dr. Copper," is a key indicator of global economic health due to its integral role in construction, electronics, and renewable energy. Its price movements provide valuable insights into industrial demand and economic trends. Tools like a copper price chart enable traders to monitor fluctuations and build copper trading strategies. Explore how the copper market works, identify key trends, explore influencing factors, and examine how copper impacts related commodities.
Copper Price Financial Market Overview
The copper market operates within a highly interconnected financial and industrial framework, shaped by factors such as global trade, industrial growth, and geopolitical developments. Major trading hubs, including COMEX (New York), LME (London), and SHFE (Shanghai), facilitate the global trade of copper, with prices quoted in U.S. dollars per pound or metric ton.
You can follow the current copper price in the live chart above. For traders looking to trade copper CFDs, historical price data can help put current price levels into context.
Copper's price history shows how it has tended to react during economic downturns and periods of industrial expansion. This historical perspective can help traders understand current market conditions.
Key Copper Market Trends
Several key trends shape the copper market:
- Inflation: Copper prices often rise during periods of higher inflation, as rising costs and strong economic activity tend to go hand in hand. Traders use copper price charts to compare price movements with inflation data.
- Industrial Demand: Copper's critical role in industries like electric vehicles (EVs), renewable energy, and smart infrastructure is a long-term source of demand. This highlights its dual nature as both a commodity and a cornerstone of industrial progress.
- Geopolitical Uncertainty: Global trade tensions and geopolitical risks can affect copper through supply disruptions and changes in demand expectations. Unlike gold, copper is not usually considered a safe-haven asset, and uncertainty that threatens economic growth can weigh on its price.
- Currency Fluctuations: Changes in the U.S. dollar affect international demand for copper. A weaker dollar tends to support copper prices, while a stronger dollar can weigh on them.
Factors Influencing Copper Price and Market Behavior
Copper prices are shaped by an interplay of supply, demand, and macroeconomic variables. Understanding these factors is essential for navigating the market:
- Supply Constraints - Mining output, often limited by geographic and regulatory challenges, constrains copper's supply. When demand grows faster than supply, this can create upward pressure on prices.
- Demand Drivers - Construction projects, technological advancements, and renewable energy initiatives are key demand drivers. A copper price chart helps traders monitor how these trends affect the price.
- Economic Indicators - Metrics such as GDP growth, manufacturing output, and employment rates heavily influence copper prices. Economic expansion typically correlates with increased industrial consumption of copper.
- Interest Rate Impacts - Higher interest rates can slow economic activity and raise the cost of holding commodities, which can weigh on copper prices. Lower rates tend to support investment and industrial demand.
- Inflation and Currency Strength - Copper prices often move with inflation, as both tend to rise when economic activity is strong. A stronger dollar reduces international affordability, while a weaker dollar supports global demand.
- Geopolitical Disruptions - Trade disputes, mine disruptions, and political instability in major producing countries such as Chile and Peru can affect supply and prices. Historical data provides context for how these events have shaped market responses.
- Market Speculation - Speculative trading introduces short-term volatility to copper prices.
Other Commodities Impacted by Copper's Price Movements
Copper's influence extends beyond its immediate market, shaping the dynamics of several related commodities:
- Aluminum: Often a substitute for copper in electrical applications, aluminum's price can rise in response to copper price increases, as both are used in similar industrial applications.
- Nickel: Used in stainless steel and battery production, nickel prices reflect broader trends in the base metals market, with copper often serving as a bellwether.
- Zinc: Zinc is used alongside copper in alloys such as brass, and both are closely tied to industrial activity, so their prices often move in similar directions.
- Mining Stocks: Companies engaged in copper mining experience significant stock price fluctuations linked to copper's performance. These fluctuations ripple across the broader commodities market, influencing investment strategies.
By understanding these interconnections, traders can better understand how copper relates to other markets.
Using Data to Understand the Copper Market
Copper's integral role in industry and its status as a barometer of economic health make it a closely watched market for traders and policymakers. Historical price data and real-time analysis via copper price charts can help traders make more informed decisions.
For those looking to trade copper or explore related commodities, knowing what drives the copper price can help you build a more informed approach to this market.
| Swap long | [[ data.swapLong ]] points |
|---|---|
| Swap short | [[ data.swapShort ]] points |
| Spread min | [[ data.stats.minSpread ]] |
| Spread avg | [[ data.stats.avgSpread ]] |
| Min contract size | [[ data.minVolume ]] |
| Min step size | [[ data.stepVolume ]] |
| Commission and Swap | Commission and Swap |
| Leverage | Leverage |
| Trading Hours | Trading Hours |
* The spreads provided are a reflection of the time-weighted average. Though Skilling attempts to provide competitive spreads during all trading hours, clients should note that these may vary and are susceptible to underlying market conditions. The above is provided for indicative purposes only. Clients are advised to check important news announcements on our Economic Calendar, which may result in the widening of spreads, amongst other instances.
The above spreads are applicable under normal trading conditions. Skilling has the right to amend the above spreads according to market conditions as per the 'Terms and Conditions'.
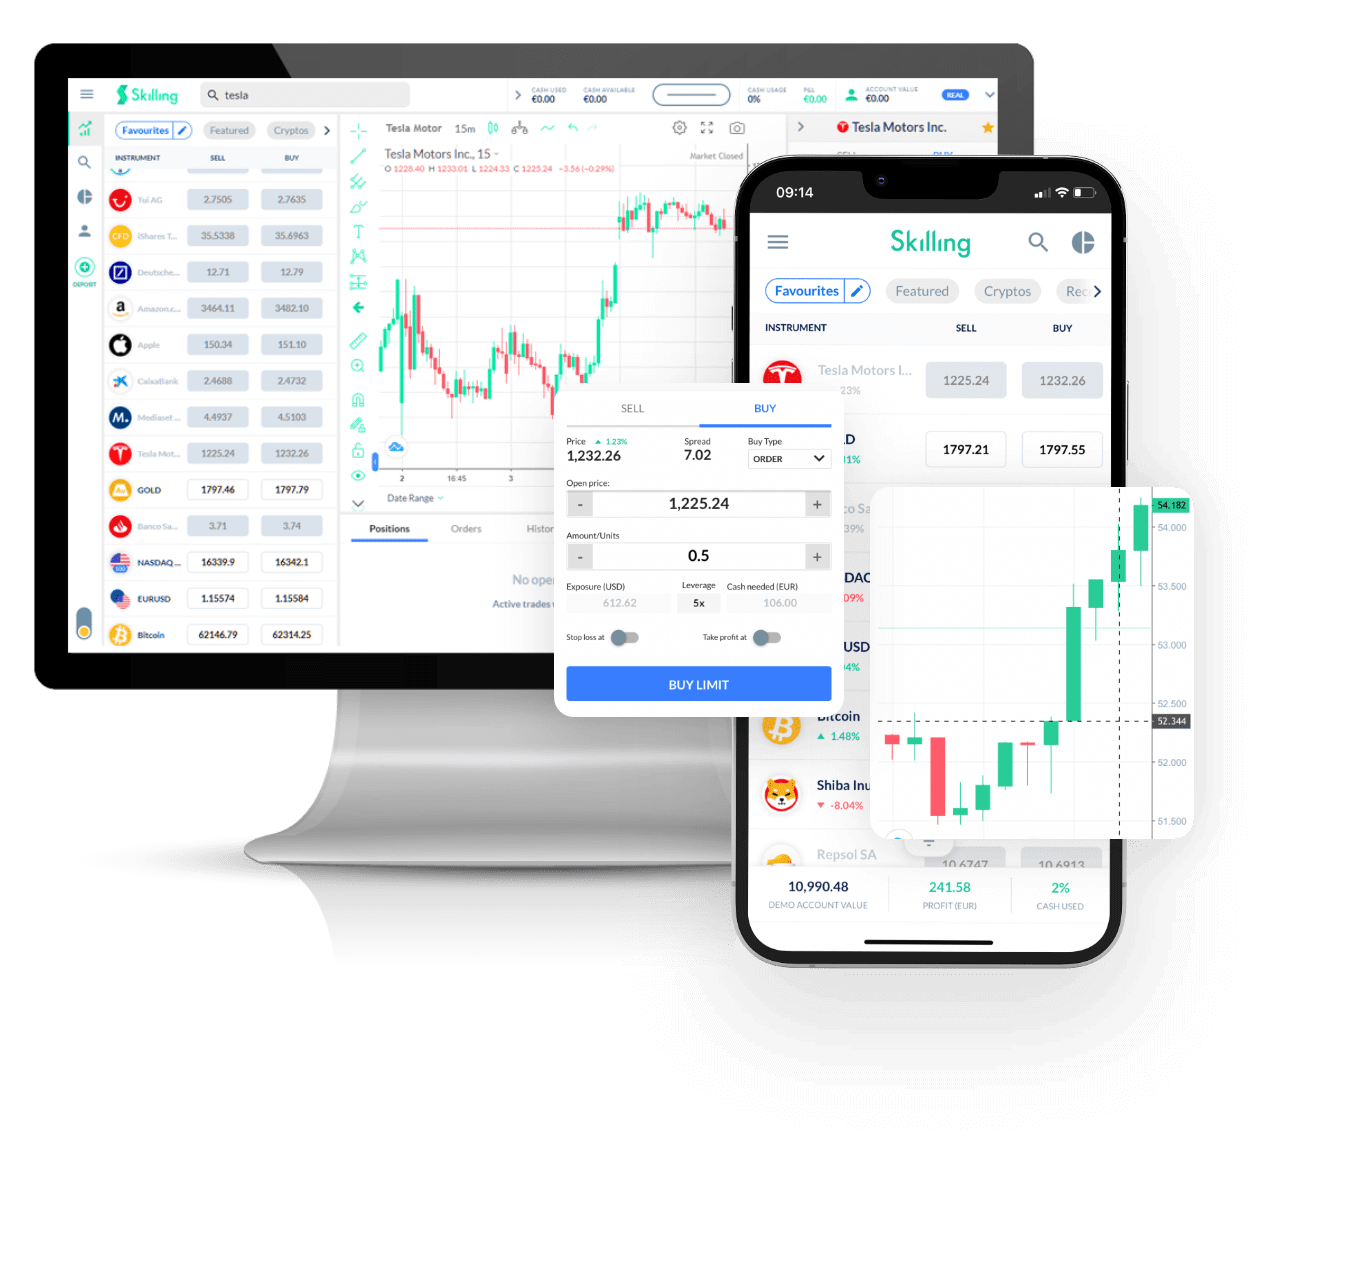
Trade [[data.name]] CFD with Skilling
Take a view on the commodity sector! Diversify with a single position.
- Trade 24/5
- Tight spreads
- Average Execution at 0.05s
- Easy to use platform
FAQs
How is copper traded in financial markets?
Copper is primarily traded on commodities exchanges such as the London Metal Exchange (LME) and the New York Mercantile Exchange (NYMEX). Traders can buy and sell copper futures contracts, which represent an agreement to buy or sell a specified amount of copper at a predetermined price on a future date.
What are the key technical indicators used to analyze copper prices?
Traders often use technical analysis tools such as moving averages, relative strength index (RSI), Fibonacci retracements, and volume analysis to identify trends and potential entry/exit points in the copper market.
What are the trading hours for copper markets?
As of May 21, 2024, the highest price copper has reached is $5.11 USD per pound. This reflects the most recent peak in copper prices up to that date. Copper prices can fluctuate due to various factors such as global economic conditions, supply and demand dynamics, geopolitical events, and market speculation. It's important to note that prices can vary between different commodities exchanges and over time.
Why Trade [[data.name]]
Make the most of price fluctuations - no matter what direction the price swings and without the restrictions that come with owning the underlying asset.
CFD
Actual Commodities

Capitalise on rising prices (go long)


Capitalise on falling prices (go short)

Trade with leverage

Trade on volatility

No commissions
Just low spreads

Manage risk with in-platform tools
Ability to set take profit and stop loss levels