


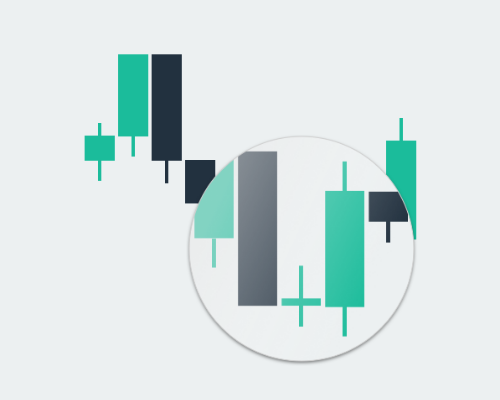
烛台形态
每个交易者都曾在某个时刻遇到过这种情况:您花费了数小时的时间阅读财经新闻、分析图表并总体上跟上市场走势。 最后,您已经确定了一个有希望的趋势,并且准备好投入其中。但是,如果该趋势不仅仅是暂时现象怎么办? 你怎么知道它是否值得长期关注?
这就是蜡烛图形态(例如延续形态和反转形态)发挥作用的地方。
- 反转模式 对于识别市场即将改变方向的情况至关重要。
- 另一方面, 持续形态 同样重要,因为它们表明市场打算坚持当前趋势。
烛台形态领域中值得关注的一个特定子集是 延续烛台形态 。
这些形态的特点是能够发出现有趋势恢复的信号,在指导交易者和投资者方面发挥着至关重要的作用。 识别和解释持续烛台模式可以使市场参与者做出更明智的决策,从而增强他们有效驾驭金融市场动态格局的能力。
反转形态
吞没烛台形态
吞没形态被认为是一种非常强大且简单的反转形态,因为它只涉及两根蜡烛。 其背后的前提是市场一直在朝着一个方向和趋势发展,如第一根蜡烛所示。 然而,市场随后改变方向并吞没了第二根蜡烛中的第一根蜡烛。 这表明情绪发生了变化。

由于这种模式经常出现并且很容易发现,因此它是识别潜在转折点或反转点的非常流行的工具。 然而,建议谨慎,因为每个时间框架都有其较大的趋势,并且在这些趋势中,您可能会发现较小趋势的转折点。 仔细选择您的时间范围并了解更大的趋势。 其次,请记住大多数模式都需要确认。 例如,当您看到反转模式时,并不意味着您必须自动卖出 - 当该模式出现在支撑位或阻力位附近时,该模式会更强。 区域。
如图所示,吞没形态由两根蜡烛组成,一根看涨,一根看跌(无论顺序如何)。 重要的是第二根蜡烛完全吞没了第一根蜡烛。 第一个蜡烛的大小并不重要,但对于第二个蜡烛来说,越大越好。 第二根蜡烛将为我们确认反转的强度/势头。
如果我们想有效地使用蜡烛图模式,我们必须确定现有趋势的方向。 移动平均线,最近的高点和低点或趋势线总是可以帮助我们看到市场上的大变动。 当我们将高时间范围内的模式分析与正确的资金管理结合起来时,吞没模式是一种非常可靠的图表工具。
Harami
Harami是另一种受欢迎的烛台形态,当一根大烛台后面跟着一根较小的烛台,且该烛台的烛身位于大烛台的垂直范围内时,就会出现这种情况。看涨的Harami给了下跌趋势逆转的迹象。而看跌的Harami则凸显了上升趋势的转捩点。当第二根蜡烛的主体较小或为十字星时,反转的可能性会增加。


晨星/黄昏星图案
这是两种看似相反的常见模式。 晨星是看涨反转蜡烛形态,而晚星是看跌转折点。 本质上,该形态包括三根蜡烛。
晨星:
- 第一根蜡烛是一根大熊蜡烛。 卖家在市场上占据主导地位。
- 第二根蜡烛在第一根和第三根蜡烛之间存在差距,可以是看涨或看跌。 通常蜡烛的主体比其他蜡烛小。 这种差距(在股票市场等具有固定开市和收市时间的市场中更为普遍)证实了买方或卖方的主导地位。
- 第三根蜡烛是一根大看涨蜡烛。 买家开始行动,这暗示着一个转折点或逆转点。
黄昏之星 形态与晨星形态相反。
- 第一根蜡烛是一根长牛蜡烛
- 第二根蜡烛开盘,有一个缺口和一根较小的蜡烛,可以是看涨或看跌。 这种差距并不总是在每种市场条件下都会发生,而且它并不是这种模式的必须具备的标准。
- 第三根烛台的卖盘占主导地位,因此它是一根大看跌蜡烛。

需要记住的重要一点是,晨星或晚星形态在围绕供给或需求区域形成时具有更大的权重,就像其他反转蜡烛形态一样。
当然,烛台形态本身并不能保证市场趋势将会逆转。 如果您要根据烛台模式进行交易,您应该始终管理您的风险。 阅读有关风险管理的更多信息。
延续模式
上升或下降三种方法
我们在持续的背景下寻找上升趋势中的上升三种方法烛台形态。下跌三法发生在趋势已经看跌且价格持续下跌的情况下。
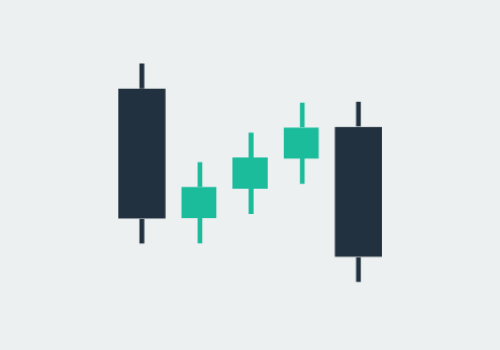
上升三种方法:
- 该形态的第一根蜡烛是一根大看涨蜡烛。
- 以下三根蜡烛是小看跌蜡烛。 它们应该位于该形态第一根蜡烛的范围内。
- 该形态的最后一根蜡烛是另一根长看涨蜡烛,创造了新高,表明买家重新掌控了局面。
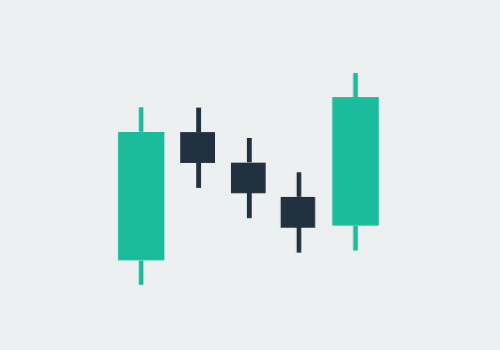
下降三种方法:
- 这与上升三法模式相反。 只是把逻辑颠倒一下。
- 第一个蜡烛是下降趋势中的长看跌烛台。
- 随后是在第一根烛台范围内交易的小型烛台。
- 第五根蜡烛是一根红色长烛,创造了新低。

最后的想法
正如所见,持续烛台模式和其他趋势标识符是交易者可以用来识别市场趋势并做出明智交易决策的有用工具。 然而,掌握这些工具需要时间和精力,交易者在交易时应始终保持谨慎和风险管理。
如果您是交易新手,我们建议您从免费的 Skilling 模拟账户 开始。 通过模拟账户,您将学习如何使用各种指标并以差价合约的形式交易各种工具,例如股票、加密货币、外汇等,而无需冒真实资金的风险。
或者您可以开设一个 Skilling 帐户 并在实时图表上使用它们。
常见问题解答
- 什么是延续烛台形态?
- 持续烛台模式是一种图表模式,表示当前趋势在继续朝同一方向发展之前暂时暂停或盘整。
- 常见的延续烛台形态有哪些?
- 一些常见的延续烛台形态包括上升三法、下降三法、看涨旗形、看跌旗形和三角旗形。这些形态表明当前趋势可能会持续下去。
- 如何辨识延续烛台形态?
- 它们可以通过特定的烛台形态来识别,例如多个小实体蜡烛,然后是趋势方向上的较大蜡烛。交易者经常寻找确认信号并使用其他技术指标进行验证。
- 什么是反转型态?
- 反转模式是表示当前趋势方向可能发生变化的图表模式。它们表明当前趋势可能已接近尾声并可能反转。
- 常见的反转型态有哪些?
- 一些常见的反转形态包括吞没烛台形态、孕育形态、晨星形态、晚星形态、锤子形态、流星形态和十字星形态。这些形态可能预示着潜在的趋势反转,受到交易者的密切关注。
- 如何辨识反转模式?
- 它们透过特定的烛台形态来识别,例如一系列较小的蜡烛后面的大吞噬蜡烛或表明市场犹豫不决的十字星。交易者经常寻找确认信号并将其与其他技术分析工具结合起来。
- 烛台形态对于交易决策可靠吗?
- 蜡烛图形态可以提供有关市场情绪和潜在价格趋势的宝贵见解。但是,重要的是要考虑其他因素,例如趋势分析、成交量和整体市场状况,以做出明智的交易决策。
不是投资建议。 过去的表现并不保证或预测未来的表现。


